 This is a teaser for the few of you who check my blog - thank you!
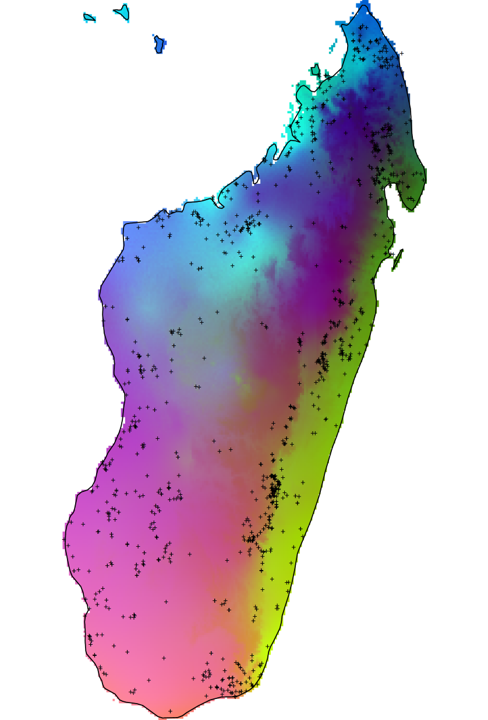
This beautiful rainbow of lemurdom illustrates the areas of endemism for lemur communities. Each dot is one of 1600+ occurrence records for 68 lemur species which I have compiled and very carefully curated over the last few months. Based on the relationship between the lemur occurrence records and the environment, this model predicts the spatial distribution of 'areas of endemism.' Areas with the same color are predicted to have a similar bunch of lemur species, and there are different species in regions with different colors. So each of these color clumps is a hotspot of unique lemurs not found elsewhere on the island. I'm investigating this to test how the environment and biogeography affect lemur diversity and distributions, and what it tells us about the way environment and history shape biodiversity distributions. There are a bunch more analyses on the way and I'm really excited about it because it's something I've been dreaming about since my first trip to Madagascar. I have always wanted to understand why lemurs are distributed where they are - is it the climate, or river barriers, or mountain barriers? There are literally dozens of hypotheses in the literature, and I'm using lemurs as a model for biogeographic evolution in Madagascar, and more generally. Stay tuned! shoot me a comment if you want to discuss methods, data, hypotheses! Here's some related reading: Niet0Lugilde et al, Elith et al
0 Comments
Leave a Reply. |
AuthorJames P. Herrera Archives
January 2023
Categories |
 RSS Feed
